Trading Stocks using Neural Networks
Standardization of Data
Calculate the mean \( \mu_l \) and standard deviation \( \sigma_l \) of each lagged feature \( L_{t,l} \). Standardize each lagged feature using:
\[ S_{t,l} = \frac{L_{t,l} - \mu_l}{\sigma_l} \]
where \( S_{t,l} \) is the standardized lagged feature at time \( t \) and lag \( l \).
Linear Regression
Perform linear regression to find the coefficients \( \beta_l \) for each standardized lagged feature \( S_{t,l} \) that best fit the actual returns \( R_t \):
\[ R_t = \beta_1 S_{t,1} + \beta_2 S_{t,2} + \ldots + \beta_{L-1} S_{t,L-1} \]
where \( L \) is the maximum lag considered.
Predictions
Predict the returns \( R_{\text{pred},t} \) using the linear regression coefficients \( \beta_l \) and the standardized lagged features \( S_{t,l} \):
\[ R_{\text{pred},t} = \beta_1 S_{t,1} + \beta_2 S_{t,2} + \ldots + \beta_{L-1} S_{t,L-1} \]
Calculate the accuracy score \( \text{Acc} \) by comparing the signs of the actual returns \( \text{sign}(R_t) \) and the predicted returns \( \text{sign}(R_{\text{pred},t}) \):
\[ \text{Acc} = \frac{\text{Number of Correct Predictions}}{\text{Total Number of Predictions}} \]
where a correct prediction occurs when \( \text{sign}(R_t) = \text{sign}(R_{\text{pred},t}) \).
Python Code
import numpy as np
import pandas as pd
import matplotlib.pyplot as plt
import yfinance as yf

data = pd.DataFrame(
    yf.download('AAPL', start='2022-01-01', end='2023-01-01')['Close'])

plt.figure()
data.plot()

ret = np.log(data / data.shift(1))
ret.dropna(inplace=True)

plt.figure()
ret.plot()

for lag in range(1,6):
    ret['lag_{}'.format(lag)] = ret.Close.shift(lag)
ret.dropna(inplace=True)
mu, std = ret.iloc[:, 1:].mean(), ret.iloc[:, 1:].std()
ret.iloc[:, 1:] = (ret.iloc[:, 1:] - mu) / std

#linear regression
reg = np.linalg.lstsq(ret.iloc[:, 1:], ret.Close)[0]
ret['pred'] = np.dot(ret.iloc[:, 1:], reg)

from sklearn.metrics import accuracy_score
score = accuracy_score(np.sign(ret.Close), np.sign(ret.pred))

print('regression accuracy: ' ,score)
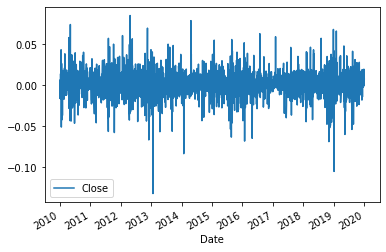
price history and returns for Apple is used:


prediction accuracy is 51.1%, which is practically useless. The reason can be twofold: linear regression is not very good
technique for modeling price movements, and/or the lagged returns are not good predictors for future price movements.
Neural Network
Multi-Layer Perceptrons (MLPs) are a class of feedforward artificial neural networks
that consist of multiple layers of interconnected nodes (neurons). MLPs are commonly
used for various machine learning tasks, including classification, regression, and
pattern recognition. Each node in an MLP is associated with weights and biases that are
adjusted during the training process to minimize the prediction error.
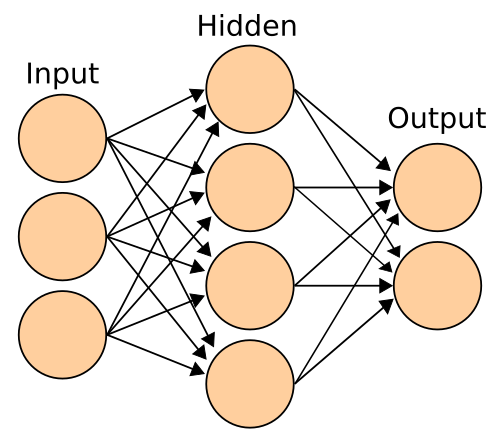
Here's the basic structure of a single hidden layer MLP:

![]()
1. Input Layer:
- Let \(X\) represent the input data. For a single data point, \(X\) is a vector of input features. For the entire dataset,
\(X\) is a matrix where each row corresponds to a data point.
2. Hidden Layers:
- An MLP can have one or more hidden layers. Each hidden layer consists of multiple neurons. The output of each neuron in
a hidden layer is calculated using an activation function.
3. Output Layer:
- The output layer produces the final prediction of the model. For regression tasks, the output layer typically contains a
single neuron.
Activation Function
- The activation function introduces non-linearity into the model, enabling it to capture complex relationships in the data.
Common activation functions include the sigmoid function, the hyperbolic tangent function, and the Rectified Linear Unit
(ReLU) function.
1. Activation of a Neuron:
- The output \(a\) of a neuron with activation function \(f\) given input \(z\) (weighted sum of inputs plus bias) is:
\[ a = f(z) \]
2. Weighted Sum and Bias:
- The weighted sum \(z\) of inputs \(x\) and weights \(w\) plus bias \(b\) for a neuron is:
\[ z = \sum_{i=1}^{n} w_i x_i + b \]
3. Activation Functions:
- Sigmoid function:
\[ \sigma(z) = \frac{1}{1 + e^{-z}} \]
- Hyperbolic tangent function:
\[ \tanh(z) = \frac{e^{z} - e^{-z}}{e^{z} + e^{-z}} \]
- ReLU function:
\[ \text{ReLU}(z) = \max(0, z) \]
4. Forward Pass:
- The forward pass computes the output of the network given input \(X\) and learned parameters \(W\) and biases \(b\) for each layer:
\[ a^{(l)} = f(W^{(l)} a^{(l-1)} + b^{(l)}) \]
where \(l\) represents the layer index.
5. Loss Function:
- The loss function measures the prediction error. For regression, Mean Squared Error (MSE) is commonly used:
\[ \text{MSE} = \frac{1}{N} \sum_{i=1}^{N} (y_i - \hat{y}_i)^2 \]
6. Training:
- Training involves minimizing the loss by adjusting the weights and biases using optimization algorithms
like gradient descent.
Python Code
The following code snippet we try the MLP regression for predicting the price movement instead of linear regression.
from sklearn.neural_network import MLPRegressor
model = MLPRegressor(hidden_layer_sizes=[256,],
                     max_iter=1000,
                     early_stopping=True,
                     validation_fraction=.25,
                     shuffle=False)
for _ in range(10):
    model.fit(ret.iloc[:, 1:], ret.Close)
    ret['pred'] = model.predict(ret.iloc[:, 1:])

    score = accuracy_score(np.sign(ret.Close), np.sign(ret.pred))

    print('NN accuracy: ' ,score)
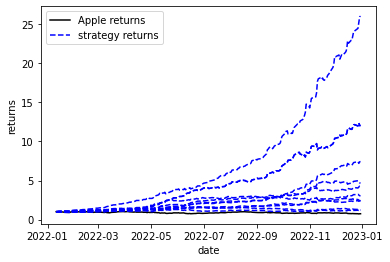
Repeating the predcition 10 times to see the overall performance. The results are better compared to linear regression.
We managed to get prediction accuracy of between 60% and 70%. So, it seems that a simple neural networks model is
capable of generating good predictions even using only lagged returns as features. We can see that using the predictions
we can potentially make insane returns of more than tenfolds.

Sounds too good to be true, right? Yes, the catch is we used
the same data to train the model and test it. We are for sure overfitting the data. Nevertheless, the method has huge
potential. The next simple steps could be using more meaningfull features for training like financial indicators for momentum
for example and then testing the model against new data.


