# Download and preprocess data
data = pd.DataFrame(columns=['price'])
data['price'] = pd.DataFrame(
    yf.download('ETH-USD', period='3mo', interval='1h')['Close'])
data['ret'] = np.log(data['price'] / data['price'].shift(1))
data.dropna(inplace=True)

plt.figure()
data[['price','ret']].plot(subplots=True)
# Feature Engineering
data['r'] = np.log(data['price'] / data['price'].shift(1)).shift(1)
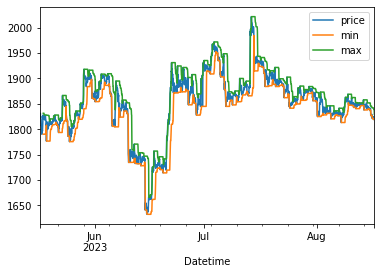
data['min'] = data['price'].rolling(24).min().shift(1)
data['max'] = data['price'].rolling(24).max().shift(1)
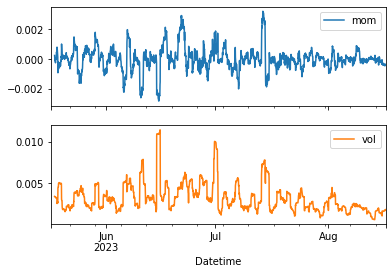
data['mom'] = data['ret'].rolling(24).mean().shift(1)
data['vol'] = data['ret'].rolling(24).std().shift(1)
data['d'] = np.where(data['ret'] > 0, 1, -1)

plt.figure()
data[['price', 'min', 'max']].plot()

plt.figure()
data[['mom', 'vol']].plot(subplots=True)

# Split data into train and test sets
split = int(len(data) * 0.8)
data.dropna(inplace=True)
train = data.iloc[:split].copy()
test = data.iloc[split:].copy()

# Feature Scaling
scaler = StandardScaler()
scaled_train_features = scaler.fit_transform(train[['r', 'min', 'max', 'mom', 'vol']])
scaled_test_features = scaler.transform(test[['r', 'min', 'max', 'mom', 'vol']])

from sklearn.ensemble import GradientBoostingClassifier

# Create and train Gradient Boosting model
gb_model = GradientBoostingClassifier(n_estimators=100, learning_rate=0.1)
gb_model.fit(scaled_train_features, train['d'])

# Make predictions and evaluate
test['gb_pred'] = gb_model.predict(scaled_test_features)
gb_score = accuracy_score(test['d'], test['gb_pred'])
print('Gradient Boosting accuracy:', gb_score)# Plot the results
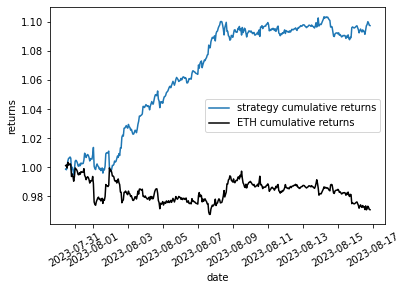
plt.figure()
plt.plot((test['gb_pred'] * test['ret']).cumsum().apply(np.exp),
label='strategy cumulative returns')
plt.plot(test['ret'].cumsum().apply(np.exp), '-k',
label='ETH cumulative returns')
plt.xlabel('date')
plt.ylabel('returns')
plt.xticks(rotation=30)
plt.legend()
plt.show()
Have questions? I will be happy to help!
You can ask me anything. Just maybe not relationship advice.
I might not be very good at that. 😁